One of the most respected power utilities in India carried out a cable condition assessment in two large 50 MW solar power plants in Karnataka, India. This decision was triggered by a previous major outage which was caused by a simple cable failure. This cable failure resulted in a long outage time, resulting in huge economic losses as well as loss of income.
Because of the remote location, it was hard to find a service provider that could quickly locate the cable fault, repair the cable and commission the circuit. As the high reliability of the MV network is critical, to reduce loss of revenue due to a power outage, the power utility decided to carry out a condition assessment on all MV cable circuits within the two solar power plants. The assessment included insulation resistance (IR), dielectric absorption ratio (DAR), tan delta measurement and partial discharge analysis (PD) tests.
Megger India was awarded tender based on their technical knowledge and experience.
Cable details
Number of circuits and age: 20 circuits, 3 years old
Type: XLPE
Type of conductor: Aluminium
Cable rating: 33 kV
Instruments used: Megger VLF Sine 62-TD, PDS 62 SIN
Sequence of testing
Tan delta measurement at 0.1 Hz
IR and DAR measurement
Off-line PD measurement at 0.1 Hz
Summary of condition assessment activities
From the 20 tested cable circuits, a total of 19 circuits were found in good condition and periodic monitoring has been recommended to monitor their ageing over time. However, one circuit showed anomalies as TD and PD results were not within the tolerance level. For this specific cable, direct action was recommended.
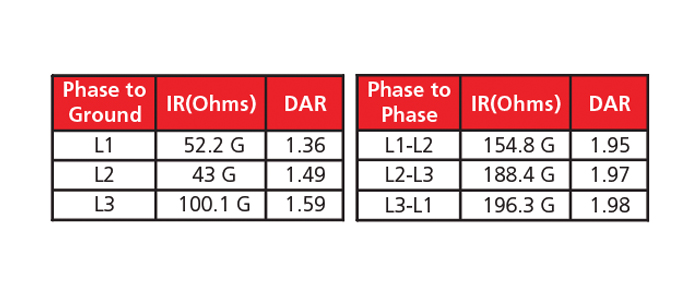
The identified cable had a length of 1002 m. The IR and DAR values showed some differences between the phases when looking to the phase-to-ground resistance. The phase-to-phase values were stable though. However, the TD diagnostics showed a large tip-up and absolute value in the Y-phase. The other two phases had normal levels. Different TD values between phases often indicate a local problem, such as issues with a joint.
Insulation resistance measurement and dielectric absorption ratio
The below graphs show the TD trend for each individual phase. It can be observed that the Y phase has far higher values compared to the R and B phases as the dielectric losses in the Y phase at 1.5 U₀ are 20 to
40 times higher. The results were compared with the evaluation
criteria set out by the IEEE 400.2-2013. The recommendations suggested “No action required” for the R and B phase but “Action required” for the Y phase.
As a local problem was indicated, it was recommended to either perform a withstand test or a PD test. A withstand test cannot guarantee that the local problem will be brought to a controlled breakdown, therefore a PD test is the best option of the two.