Test Results
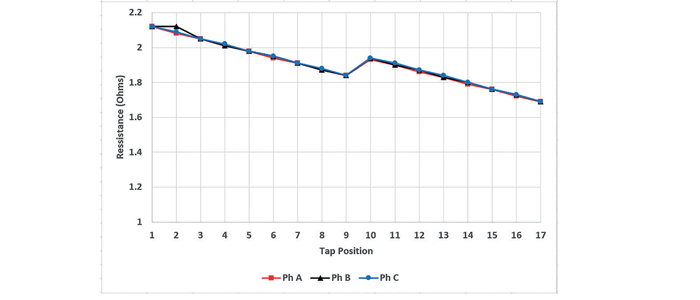
In this case, the DC WRM on all tap positions (a series of static measurements, Figure 1) shows a very small variation (around 0.2 %) between the three phases and for all taps. This is well within the generally agreed, maximum allowable variation of 2 – 3 %.
Looking at the TTR measured values (Figure 2), it was observed that all phases and all taps have a measured ratio well within the generally agreed acceptance value of 0.5 %.
The Line-Frequency (LF) power factor (PF), or dissipation factor (DF), and NB DFR (narrowband dielectric frequency response) test results (Figure 3) were acceptable. No notable insulation degradation was indicated.
Advanced OLTC testing was carried out with the Dynamic Resistance Measurement application in the TRAX SW. During the transition from one tap position to the next, the current drops and that is represented by the ‘ripple’, which expresses the maximum amount that the DC current decreases as a percentage of the test current. The ripple is normally plotted for all phases and taps as presented in Figure 4.
The ripple graph from phase B may be different compared to the graphs of phase A and/or C due to different induction.
In this case, the difference in ripples between phases combined with the variance of ripples within Phase B indicate a problem for Phase B.
DRM analysis provides even more insight than comes from measuring the ripple alone. In a ‘true’ DRM test, the transition resistors’ values are determined with great precision. Figure 5 shows the dynamic resistance for transition 12-13 for Phase C and Figure 6 shows the DRM for transition 13-12 for phase B. Notice the difference in scales on the y-axis (in ohms) of both graphs.
Figure 5 is a typical transition DRM response for a 2-resistor switch that has been in service for some time. Resistance values and transition times for both resistors are similar.